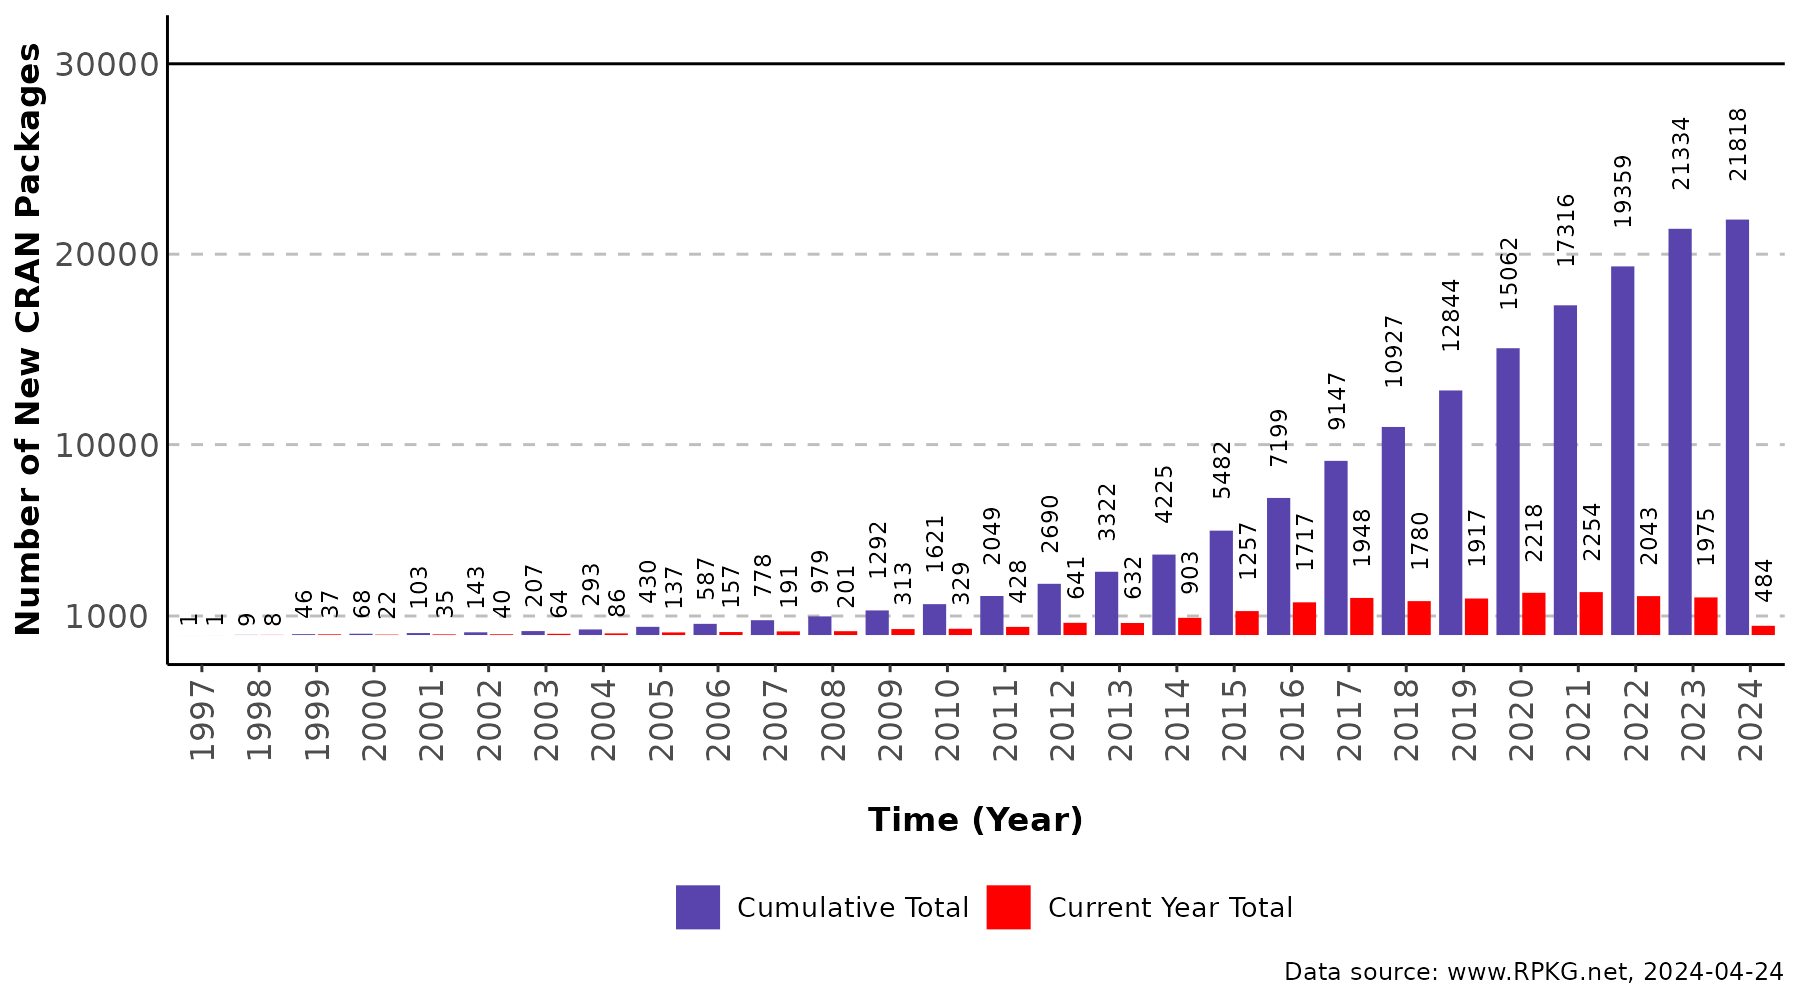
A platform that allows you to search through 24,098 R packages, compare across various packages based on name or keywords in their descriptions.
| Rank | Name | Title | Release version | Maintainer |
|---|---|---|---|---|
| 1 | clockSim | Streamlined Simulation of Circadian Gene Networks | 0.1.1 | Ye Yuan |
| 2 | GBOP2 | Generalized Bayesian Optimal Phase II Design (G-BOP2) | 0.1.2 | Wanni Lei |
| 3 | ananke | Quantitative Chronology in Archaeology | 0.1.0 | Nicolas Frerebeau |
| 4 | cheetahR | High Performance Tables Using 'Cheetah Grid' | 0.1.0 | Olajoke Oladipo |
| 5 | slash | Path-Based Access and Manipulation of Nested Lists | 0.1.0 | Mohamed El Fodil Ihaddaden |
| 6 | tailplots | Estimators and Plots for Gamma and Pareto Tail Detection | 0.1.0 | Bernhard Klar |
| 7 | EMTscore | Calculate 'EMT' Scores Based on 'Omics' Data | 0.1.1 | Haimei Wen |
| 8 | IBDInfer | Design-Based Causal Inference Method for Incomplete Block Designs | 0.0.1 | Taehyeon Koo |
| 9 | maxbootR | Efficient Bootstrap Methods for Block Maxima | 1.0.0 | Torben Staud |
| 10 | mmequiv | Calculate Standardized Morphine Milligram Equivalent Doses | 0.1.1 | Kenneth A. Taylor |
| 11 | netdose | Dose-Response Network Meta-Analysis in a Frequentist Way | 0.6-0 | Maria Petropoulou |
| 12 | shinyDTC | Simple Dynamic Timer Control | 0.1.0 | Sigbert Klinke |
| 13 | TCRconvertR | Convert TCR Gene Names | 1.0 | Emma Bishop |
| 14 | yfinancer | 'Yahoo Finance' API Wrapper | 0.1.3 | Giovanni Colitti |
| 15 | budgetIVr | Partial Identification of Causal Effects with Mostly Invalid Instruments | 0.1.2 | Jordan Penn |
| 16 | fastqrs | Fast Algorithms for Quantile Regression with Selection | 1.0.0 | Santiago Pereda-Fernandez |
| 17 | featForge | Automated Feature Engineering for Credit Scoring | 0.1.2 | Rudolfs Kregers |
| 18 | PathwayVote | Robust Pathway Enrichment for DNA Methylation Studies Using Ensemble Voting | 0.1.0 | Yinan Zheng |
| 19 | remulate | Simulate Dynamic Networks from Relational Event Models | 2.1.0 | Rumana Lakdawala |
| 20 | Rsubbotools | Fast Estimation of Subbottin and AEP Distributions (Generalized Error Distribution) | 0.0.0.9 | Elias Haddad |
| 21 | tAI | The tRNA Adaptation Index | 0.2.2 | Mario dos Reis |
| 22 | waetr | 'WebAIM' 'WAVE' Accessibility Evaluation Tool | 0.1.0 | Benjamin Listyg |
| 23 | cdfinv | Confidence Interval Estimation via CDF Inversion | 0.1.0 | Peter E. Freeman |
| 24 | cobenrich | Using Multiple Continuous Biomarkers for Patient Enrichment in Two-Stage Clinical Designs | 1.0.1 | Jiangtao Gou |
| 25 | funMoDisco | Motif Discovery in Functional Data | 1.0.0 | Jacopo Di Iorio |
| 26 | gkwreg | Generalized Kumaraswamy Regression Models for Bounded Data | 1.0.3 | Lopes J. E. |
| 27 | heatindex | Calculating Heat Stress | 0.0.1 | David M. Romps |
| 28 | hyper.gam | Generalized Additive Models with Hyper Column | 0.1.0 | Tingting Zhan |
| 29 | rLakeHabitat | Interpolate Bathymetry and Quantify Physical Aquatic Habitat | 1.0.0 | Tristan Blechinger |
| 30 | vayr | Extensions for 'ggplot2' to Visualize as You Randomize | 1.0.0 | Alexander Coppock |
| 31 | whirl | Log Execution of Scripts | 0.2.0 | Aksel Thomsen |
| 32 | artma | Automatic Replication Tools for Meta-Analysis | 0.1.19 | Petr Čala |
| 33 | butterfly | Verification for Continually Updating Time Series Data | 1.1.2 | Thomas Zwagerman |
| 34 | e2tree | Explainable Ensemble Trees | 0.1.2 | Massimo Aria |
| 35 | energymethod | Two-Sample Test of many Functional Means using the Energy Method | 1.0 | David Colin Decker |
| 36 | FLAG | Flexible and Accurate Gaussian Graphical Models | 0.1 | Yueqi QIAN |
| 37 | ProteinPCA | Principal Component Analysis (PCA) Tool on Protein Expression Data | 0.1.0 | Paul Angelo C. Manlapaz |
| 38 | clootl | Fetch and Explore the Cornell Lab of Ornithology Open Tree of Life Avian Phylogeny | 0.1.1 | Eliot Miller |
| 39 | correlationr | Conduct Robust Correlations on Non-Normal Data | 0.1.0 | Aurora Robert |
| 40 | ernm | Exponential-Family Random Network Models | 1.0.0 | Duncan Clark |
| 41 | EZFragility | Compute Neural Fragility for Ictal iEEG Time Series | 1.0.3 | Jiefei Wang |
| 42 | geoprofiler | Perpendicular Line Transects for Geosciences | 0.0.2 | Tobias Stephan |
| 43 | hera | Companion to the 'xeus-r' 'jupyter' Kernel | 0.1.1 | Romain François |
| 44 | isard | Overflow Data for Quantitative Peace Science Research | 0.1.0 | Steve Miller |
| 45 | marcox | Marginal Hazard Ratio Estimation in Clustered Failure Time Data | 1.0.0 | Junyi Chen |
| 46 | MCSimMod | Working with 'MCSim' Models | 0.9.1 | Dustin F. Kapraun |
| 47 | neuroim2 | Data Structures for Brain Imaging Data | 0.8.1 | Bradley R Buchsbaum |
| 48 | piiR | Predictive Information Index ('PII') | 0.2.0 | Kevin E. Wells |
| 49 | puff | Simulate and Visualize the Gaussian Puff Forward Atmospheric Model | 0.1.0 | Philip Waggoner |
| 50 | PwePred | Event/Timeline Prediction Model Based on Piecewise Exponential | 1.0.0 | Tianchen Xu |
| 51 | tickr | Consistent Axis Tick Marks | 1.0.2 | Benjamin C. Williams |
| 52 | ztils | Various Common Statistical Utilities | 1.0.0 | Zach Peagler |
| 53 | AdsorpR | Adsorption Isotherm Models | 0.1.0 | Jajati Mandal |
| 54 | flexoki | Inky Color Schemes | 0.0.1 | Christopher T. Kenny |
| 55 | nimblewomble | Bayesian Wombling using 'nimble' | 0.1.0 | Aritra Halder |
| 56 | npdsim | Simulate Demand and Attributes for New Products | 1.0.0 | Mohammed Hichame BENBITOUR |
| 57 | seinfitR | Modeling the Relationship Between Nematode Densities and Plant Growth | 1.0.1 | João Novoletti |
| 58 | slurm | Running and Parsing Slurm Commands | 2025.4.9 | Toby Hocking |
| 59 | valh | Interface Between R and the OpenStreetMap-Based Routing Service Valhalla | 0.1.0 | Timothée Giraud |
| 60 | vvbitwarden | Interacts with 'Bitwarden Secrets Manager' | 0.1.0 | Hajo Bons |
| 61 | yfscreen | Yahoo Finance 'screener' API | 0.1.1 | Jason Foster |
| 62 | basepenguins | Convert Files that Use 'palmerpenguins' to Work with 'datasets' | 0.1.0 | Ella Kaye |
| 63 | childeswordfreq | Word Frequency Extraction and Summarization | 0.1.0 | Nahar Albudoor |
| 64 | coda.plot | Plots for Compositional Data | 0.1.8 | Marc Comas-Cufí |
| 65 | ctsmTMB | Continuous Time Stochastic Modelling using Template Model Builder | 1.0.0 | Phillip Vetter |
| 66 | DLMRMV | Distributed Linear Regression Models with Response Missing Variables | 0.1.0 | Guangbao Guo |
| 67 | immundata | A Unified Data Layer for Single-Cell, Spatial and Bulk Immunomics | 0.0.1 | Vadim I. Nazarov |
| 68 | lme4GS | 'lme4' for Genomic Selection | 0.1 | Paulino Perez Rodriguez |
| 69 | PhotoGEA | Photosynthetic Gas Exchange Analysis | 1.3.2 | Edward B. Lochocki |
| 70 | postcard | Estimating Marginal Effects with Prognostic Covariate Adjustment | 1.0.0 | Mathias Lerbech Jeppesen |
| 71 | sdlrm | Modified Skew Discrete Laplace Regression for Integer-Valued and Paired Discrete Data | 0.1.2 | Rodrigo Medeiros |
| 72 | spect | Survival Prediction Ensemble Classification Tool | 1.0 | Stephen Abrams |
| 73 | CardioCurveR | Nonlinear Modeling of R-R Interval Dynamics | 1.0.0 | Matías Castillo-Aguilar |
| 74 | DasGuptR | Das Gupta Standardisation and Decomposition | 2.1.0 | Josiah King |
| 75 | groupedHyperframe.random | Simulated Grouped Hyper Data Frame | 0.1.0 | Tingting Zhan |
| 76 | HTGM2D | Two Dimensional High Throughput 'GoMiner' | 1.0 | Barry Zeeberg |
| 77 | pangoling | Access to Large Language Model Predictions | 1.0.3 | Bruno Nicenboim |
| 78 | pplot | Chronological and Ordered p-Plots for Empirical Data | 0.9 | Roland Pfister |
| 79 | QR.break | Structural Breaks in Quantile Regression | 1.0.1 | Zhongjun Qu |
| 80 | sdtm.terminology | CDISC SDTM Controlled Terminology | 2025-3-25 | Ramiro Magno |
| 81 | StatTools | All-in-One Chi Distribution CI | 0.1.1 | David Reese |
| 82 | tvcure | Additive Cure Survival Model with Time-Varying Covariates | 0.6.6 | Philippe Lambert |
| 83 | visor | Geospatial Tools for Visibility Analysis | 0.1.0 | Claudiu Forgaci |
| 84 | CytoProfile | Cytokine Profiling Analysis Tool | 0.2.0 | Shubh Saraswat |
| 85 | DamageDetective | Detecting Damaged Cells in Single-Cell RNA Sequencing Data | 1.0.0 | Alicen Henning |
| 86 | FARS | Factor-Augmented Regression Scenarios | 0.1.0 | Gian Pietro Bellocca |
| 87 | friendlynumber | Translate Numbers into Number Words | 1.0.0 | Ethan Sansom |
| 88 | NHSRwaitinglist | Waiting List Metrics Using Queuing Theory | 0.1.0 | Chris Mainey |
| 89 | RobinCar2 | ROBust INference for Covariate Adjustment in Randomized Clinical Trials | 0.1.1 | Liming Li |
| 90 | RStanTVA | TVA Models in 'Stan' using 'R' and 'StanTVA' | 0.2.1 | Maximilian M. Rabe |
| 91 | spatemR | Generalized Spatial Autoregresive Models for Mean and Variance | 1.0.0 | Nelson Alirio Cruz Gutierrez |
| 92 | tabs | Temporal Altitudinal Biogeographic Shifts | 0.1.0 | Johannes De Groeve |
| 93 | TractorTsbox | Wrangle and Modify Ts Object with Classic Frequencies and Exact Dates | 0.1.1 | Tanguy Barthelemy |
| 94 | bidsr | A Brain Imaging Data Structure ('BIDS') Parser | 0.1.0 | Zhengjia Wang |
| 95 | castgen | Estimate Sample Size for Population Genomic Studies | 1.0.2 | Alexander M. Sandercock |
| 96 | HTGM | High Throughput 'GoMiner' | 1.1 | Barry Zeeberg |
| 97 | ieTest | Indirect Effects Testing Methods in Mediation Analysis | 2.0 | John Kidd |
| 98 | InterpolateR | A Comprehensive Toolkit for Fast and Efficient Spatial Interpolation | 1.2-0 | Jonnathan Landi |
| 99 | maxEff | Additional Predictor with Maximum Effect Size | 0.1.1 | Tingting Zhan |
| 100 | mbg | Model-Based Geostatistics | 1.0.0 | Nathaniel Henry |
I sometimes ask myself a question - how can I find an R package that does X Y Z? Well, there are many sites that give you that answer. But I still feel that they aren't giving enough. That's why I built this site. If you like it, then go to https://github.com/oobianom and give me a thumbs up.